Back to all projects
„Изолации“ ЕООД · Varna, Bulgaria · 2026

AI UX in RealEstate

Making a builder’s stock readable at a glance

A residential developer in Varna sells four buildings at once and had no way to show what was left in them. Their brief was a single sentence: buyers need a register of the units they can orient themselves in, at any moment. I rebuilt the site around that — one record per apartment, garage and parking space, and a different way of reading it on every screen where a buyer asks a different question.

AI UX in RealEstate preview
Role
Solo — research, UX, design system, full build, data pipeline
Timeline
2026 · 12 working days
Focus
Inventory UX · Spatial interfaces

Tech Stack

WordPress block themePHPSQLiteVanilla JSSVGPython (stdlib only)CSS design tokensAI image editing
503
units in one live register, across 15 projects
94
parking spaces traced off the architect's PDF
3
languages served from the same record
~500 h
the same build estimated for one developer without AI

A look inside

01 — The Problem

The existing site put each building’s stock in one HTML table — up to 177 rows, sorted by nothing a buyer cares about, with no filter and no colour. Sold flats had simply been deleted from it, so “20 free” read as twenty lonely rows instead of twenty out of eighty-seven. Reserved units had the word РЕЗЕРВИРАН typed into the price cell. Block headings were faked by writing “БЛОК 8” into all nine cells of a row. And underneath the numbers sat the question the table structurally cannot answer. A buyer does not want a list of what is free; they want to know where the free one is — which floor, which side, whether the garage is next to the ramp or next to the lift. Every one of those answers was “come and see us”, which is a phone call the client had to take, one buyer at a time.

02 — The Solution

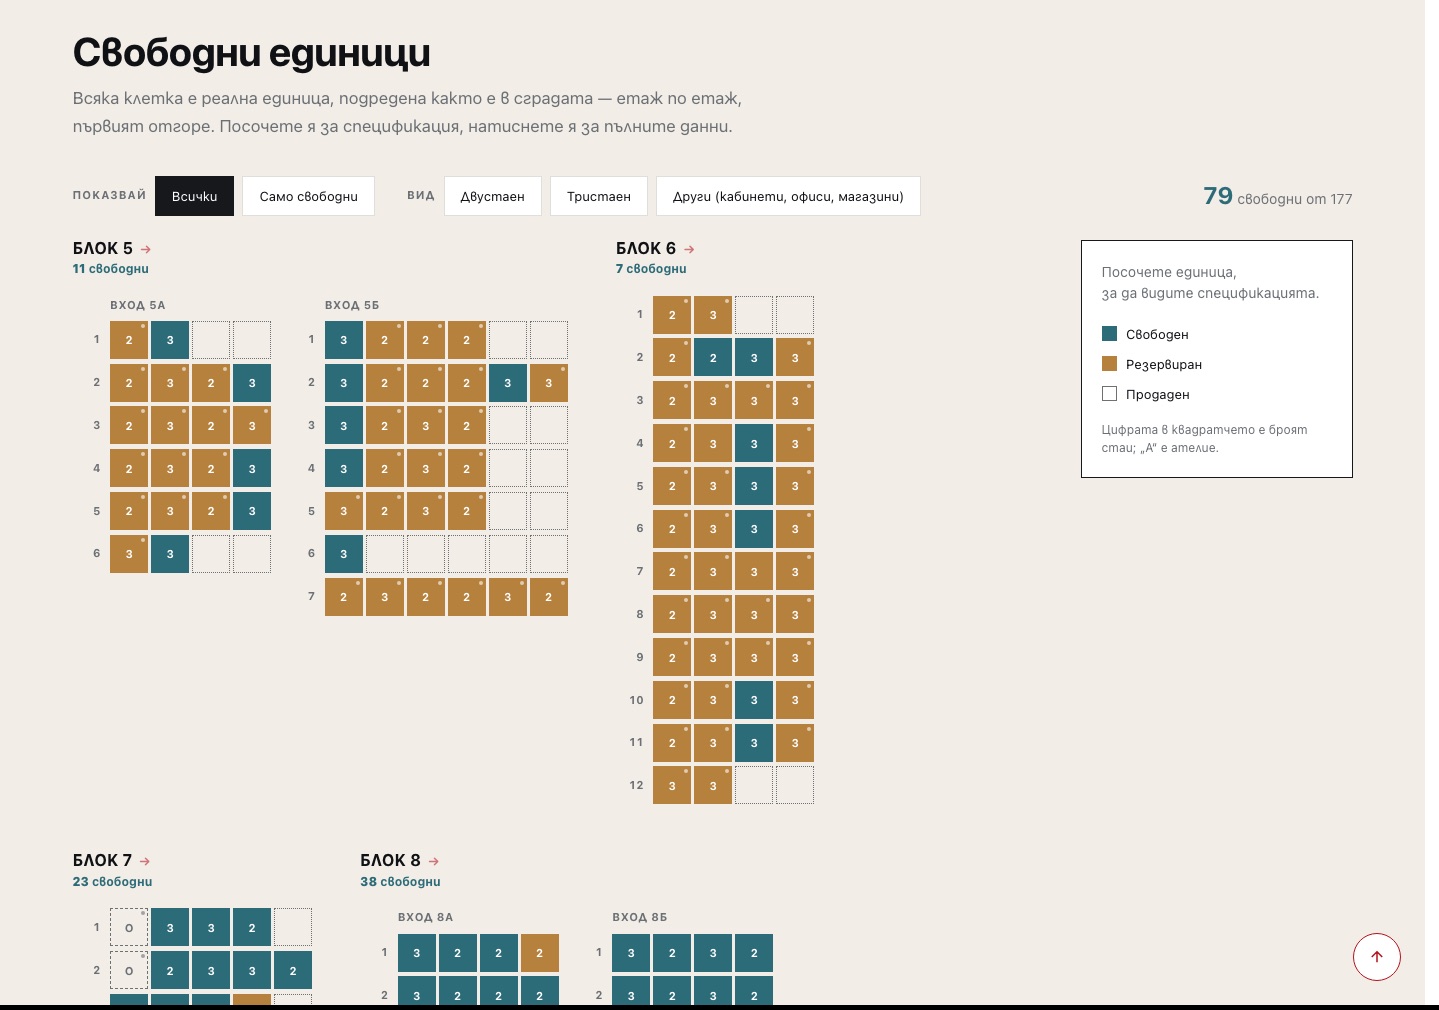
One data model, several readings. Every apartment, office, garage and parking space became a single record with one status, so a unit marked sold once is sold everywhere — the board, the price list, the floor plan, the JSON feed. Then each screen answers the question that screen is actually for. The availability board draws the building itself: one column per staircase, floors stacked with the top floor at the top, colour on what is free. The price list stays for people who came to compare numbers, sortable and pre-filtered to what is available. And for the underground garages, the availability is painted directly onto the architect’s own floor plan — the drawing the client already had, now live.

Problem 01

A price list cannot tell you where you would live

The building has an elevation, a staircase and a side facing the lake. A table has none of that, so a buyer scanning 177 rows has to hold the building in their head while they read. Almost nobody does — they call and ask.

So the units are laid out as the building is: blocks side by side, floors stacked with the top floor at the top, one column per вход (staircase) rather than per block. That distinction turned out to matter more than anything else on the screen. Two of the blocks have two staircases, and grouping on the block alone put 5А-2 and 5Б-1 in a shared “floor 1” row they do not share in life. Grouped by staircase, the grid finally reads as a building.

Colour carries availability, and only availability: turquoise for free, wool brown for reserved, a hollow outline for sold. The hollow cell is deliberate — “this one is gone” should read as absence, not as another colour to decode. The number printed inside each cell is the room count, so the two questions a buyer asks first are answered by one glance at one square.

Blocks 5 and 6 publish 23 flats of the 87 their own numbering reaches. The missing 64 are drawn as empty cells: they hold their place in the elevation and assert nothing. They are not stock and are counted nowhere — but without them the building would have holes it does not have.

The whole board works with JavaScript switched off, because every cell is a real link. The hover preview and the touch sheet are enhancements on top of a page that is already complete.

Same 177 apartments, two ways of asking

Before — a table, 177 rows long

ВходАп.Ет.Спалним²Цена
А8А-154275,51118 550
А8А-164148,8383 020
А8А-1752102,48160 900
А8А-185167,79РЕЗЕРВИРАН
А8А-195275,51118 550
А8А-205148,8383 020

No filter, no colour, sold flats simply deleted — and nothing anywhere says which of these is the corner flat facing the lake.

so

After — the building, drawn

Вход 8А

12323
22323
32323
42323
5232
623
  • Free
  • Reserved
  • Sold
  • Not published

One column per staircase, ground floor at the bottom, the number in the cell is the room count. Every cell is a real link, so it works with JavaScript off.

Problem 02

The parking question a table structurally cannot answer

The price list tells you which garages are free. It cannot tell you which one is next to the lift, which one is on the ramp, or which one you will spend five years reversing into. That is the only question a garage buyer has, and the answer had always been “come and see”.

The client already owned the answer: a PDF of the architect’s underground level. So availability is painted straight onto it — one SVG polygon per garage, over the drawing itself, coloured by the live status of that unit.

Getting there meant extracting 94 rooms from a drawing that contains no rooms — 102,434 line segments and not one of them labelled “garage”. Three properties of the drawing made it possible and, more importantly, checkable: load-bearing walls are the only lines at 0.992pt in pure black, so dimension chains and column hatching fall away; each label is left-aligned, so the number is matched on the x-position of the word “Гараж” rather than on proximity, which would otherwise hand garage 45 a stray dimension; and because a garage door is a hole in the wall rather than a line, the open side is closed using the area printed in the label divided by the measured width.

The legend here is the exact inverse of the board’s, at the client’s request, and they were right. On a drawing of 94 rooms the buyer is hunting for where they *can* go, so colour marks what is taken and free space stays white — which is also the only fill that does not muddy the number and the area printed inside the room.

From the price list you click a garage and land on its own page, where the same drawing appears again with that one garage outlined in blue. Fill carries status, outline carries place. It is the same rendering component with one extra argument — a second, nearly identical implementation is how two pages quietly drift apart six months later.

Two sources, one drawing

Geometry

Source
The architect's PDF — 102,434 line segments
Computed
Once, offline, by hand — verified against the drawing
Lives in
94 polygons as JSON + one PNG, both in git
Changes
Only when a new floor is drawn

Status

Source
The database — the same record the price list reads
Computed
On every page load
Lives in
Post meta, edited in the admin grid
Changes
Whenever a sales manager marks a garage
joined on code = „Гараж 45“

A polygon with no unit behind it is silently skipped rather than drawn grey. Nobody runs a script to publish a change — and the server needs neither Python nor a PDF toolchain, which is the point.

Getting 94 rooms out of a drawing that contains none

  1. 1Walls found by stroke width — only the load-bearing lines are 0.992pt pure black, so dimension chains and column hatching drop out
  2. 2The label names the room and gives its area — matched on left-edge alignment, not proximity
  3. 3The garage door is a hole, not a line, so the open side is closed using area ÷ measured width

The decisions

What I did about it.

Drew the building instead of listing it

Replaced the price table as the primary view with an availability board laid out as the elevation — one stack per staircase, floors in physical order, colour on what is free. The table stayed, one click away, for people who came to compare numbers.

→ free vs. gone, readable in one glance

Put availability on the architect’s own drawing

Extracted 94 garage polygons from the underground floor plan and overlaid them on the drawing, coloured live by status, with zoom, pan and a price panel per room.

→ “which one is by the lift” answered without a phone call

Split geometry from status, permanently

Geometry is computed once, offline, by hand, and committed to the repository. Status is read from the database on every request. The two meet on the unit code and nothing else.

→ the client marks a garage reserved and the plan recolours — no script, no Python on the server

Rebuilt the status palette around colour blindness

The first admin palette was green for free and brown for reserved. Under deuteranopia and protanopia — up to 8% of men — both degrade to the same olive, on the one screen whose entire job is changing a status. The replacement separates the four statuses on three axes at once: hue on the blue–yellow channel, lightness, and fill (solid / tint / hollow outline).

→ the two most common statuses stay distinct in every simulation, and in black and white

Built the client an editing surface, not a CMS lecture

A spreadsheet-shaped admin grid: every unit a row, every field an input, one Save for all of them, Enter moves down the column, plus bulk status changes and CSV round-trip with a BOM so Excel opens the Cyrillic correctly.

→ 82 apartments edited on one screen instead of 82 page loads

Used AI to finish the team photos instead of booking a shoot

Two of the three portraits came from a real studio session; the third person had only a casual photo, which left the row looking mismatched. An AI pass re-lit and re-staged that real photograph to match the existing shoot’s background, lighting and framing.

→ one consistent team row, at the cost of an afternoon rather than a photographer

The pipeline

From the client’s spreadsheet to every screen.

  1. 1

    Their own price sheets

    The client sends .xlsx price lists. A dependency-free reader parses them and merges on (block, code) — no library, no upload step.

  2. 2

    One record per unit

    Apartment, office, garage or parking space, each with one status. The field contract lives in a single array that drives the model, the admin grid, the CSV columns and the JSON feed together.

  3. 3

    The admin grid

    The client edits statuses in a spreadsheet-shaped screen built for exactly that, with the unsaved-changes guard that implies.

  4. 4

    Every surface reads it

    Board, price list, floor plan, unit page and the public JSON feed all render the same record. A status changed once is right everywhere.

  5. 5

    Three languages, one truth

    Bulgarian, English and Russian are 460+ keys substituted over the output — one post carries the availability, so two translations can never disagree about which flat is free.

What shipped

The pieces.

Availability board — the building drawn as a grid, one stack per staircase
Live floor plan — 94 garages as SVG polygons over the architect’s drawing
“You are here” — the same plan on each unit page, that room outlined
Sortable price list, opening pre-filtered to what is available
Spreadsheet-shaped admin grid with bulk status changes and CSV round-trip
Colour-blind-safe status palette, verified against deuteranopia and protanopia
Full BG / EN / RU, including per-project copy edited by the client
Works with JavaScript off — every cell and polygon is a real link

05 — Why It Matters

The client’s brief, in their words, was “a database of the units in table form, that customers can use to orient themselves about what is free and how it looks at any given moment.” The word doing the work there is orient — which is spatial, and which a table cannot do. Everything on this site follows from taking that one word literally: the same inventory, rendered as the building, as the drawing, and as the list, so the buyer picks whichever answers the question they arrived with.

06 — Impact & Value

What it’s worth.

503 units

across 15 projects, in one register that every screen reads from.

94 spaces

of underground parking made browsable on the architect’s own drawing.

12 days

from empty repo to a complete site — estimated at 450–600 hours for one developer without AI.

Zero plugins

WordPress on SQLite, one custom block theme, no page builder — nothing to renew or break.

08 — What I Learned

Takeaways.

  • A list and a drawing answer different questions. The buyer scanning a price table and the buyer looking for the corner flat are the same person thirty seconds apart, and one interface cannot serve both — so ship both and let them switch.
  • The legend that is correct on one screen is wrong on the next. Colour marks what is free on the board and what is taken on the floor plan, because a buyer scanning 94 rooms is hunting for the gaps. Same data, opposite encoding, both right.
  • Colour must differ on more than hue. Green and brown are obviously distinct until you simulate deuteranopia and watch both collapse into the same olive — on the exact screen whose job is telling them apart.
  • Separate what is expensive and permanent from what is cheap and constantly changing. Geometry offline and committed, status live from the database; the whole floor plan works because those two never got mixed.
  • AI is at its best doing the boring half of real work. It did not invent a person — it re-lit an existing photograph of a real employee to match a shoot that had already happened, which is a job with a known right answer.

A builder’s website is usually a brochure with a phone number. This one is a live register of 503 homes and parking spaces that a buyer can read the way they would read the building.